THEMIS Mars hot springs

Figures

Every figure in the report, in report order. Each caption links to the full-resolution PNG. Figures marked v2 were corrected on 2026-09-07; the superseded originals are at the bottom for the record.

Detectability and the regional search
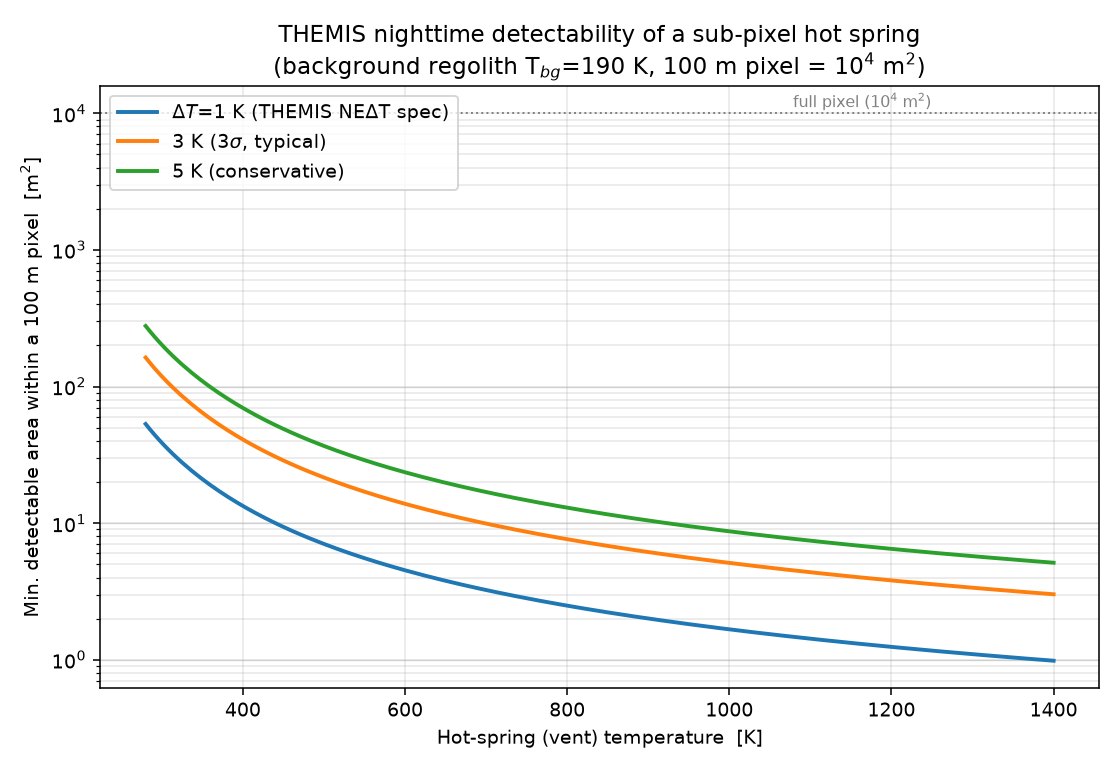
Minimum detectable hot-spring area vs vent temperature for a 100 m nighttime pixel over 190 K regolith. A boiling spring filling 17 m² (0.17% of a pixel) raises it by 1 K. PNG
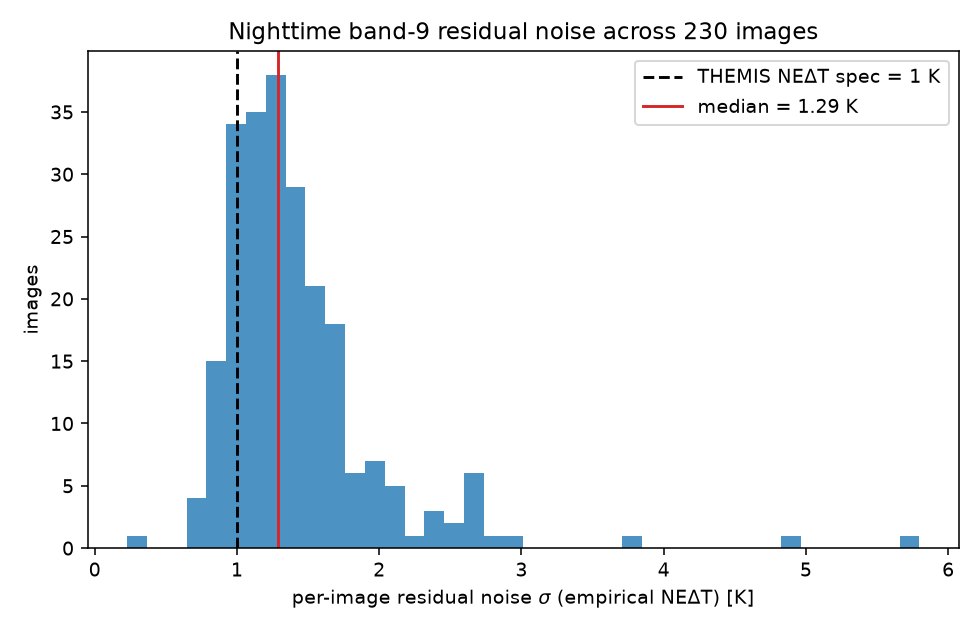
Per-image residual noise (MAD σ after background removal, an upper bound on NEΔT) across the 230 regional images; median 1.29 K. PNG
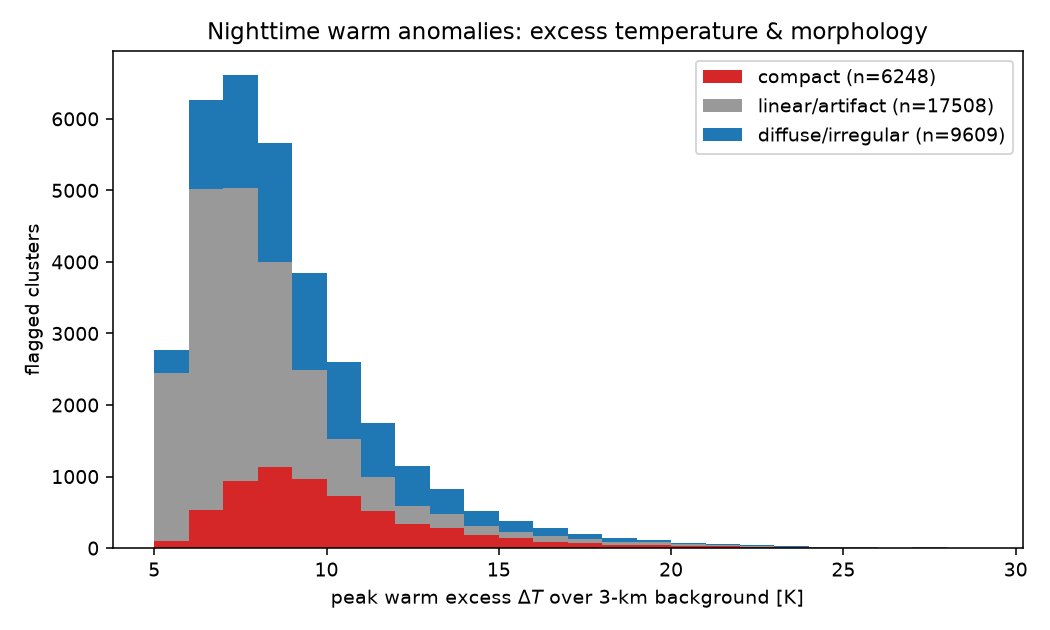
Excess-temperature distribution of the 33,365 flagged warm clusters by morphology: 6,248 compact, 17,508 linear/artifact, 9,609 diffuse. PNG
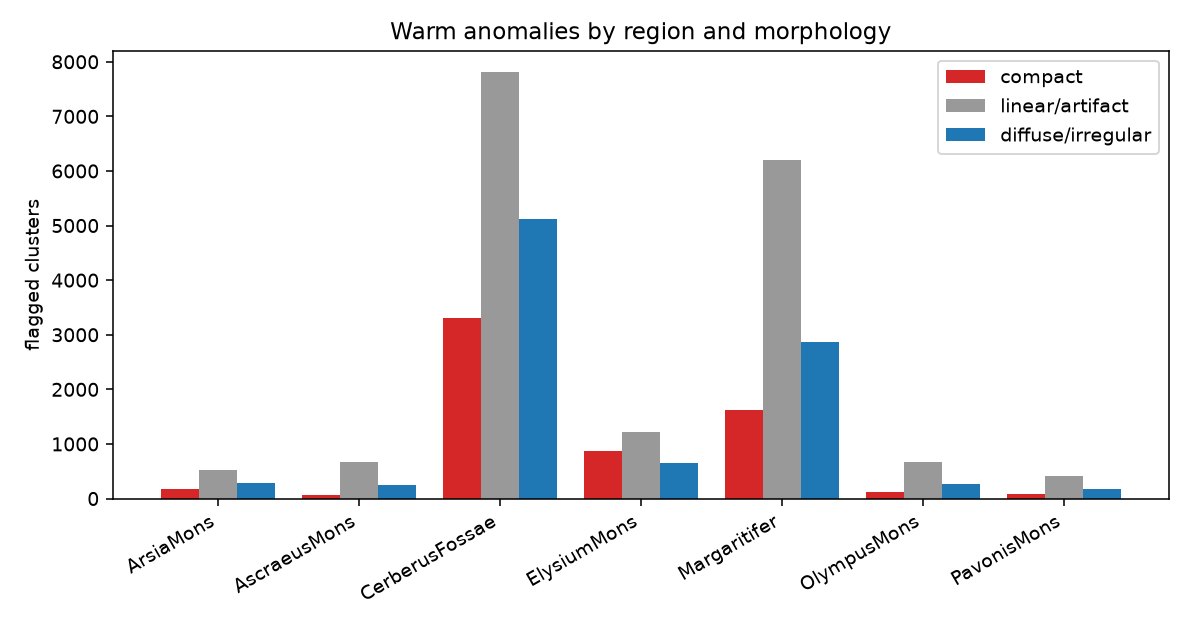
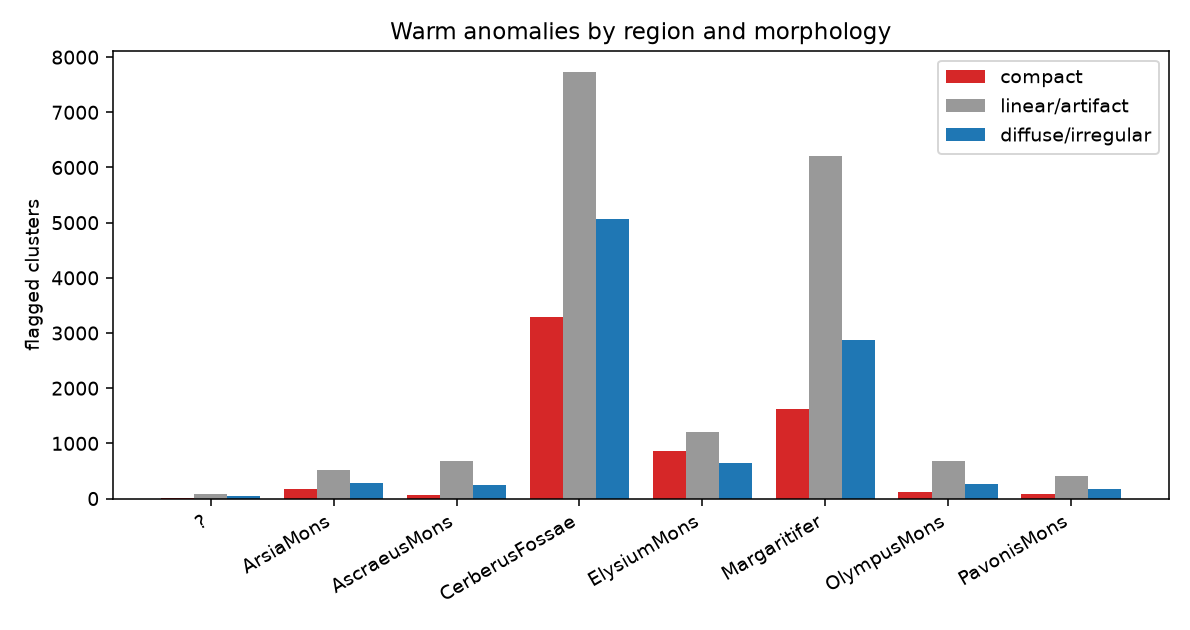
Flagged clusters by region and morphology (v2: one image previously labelled "?" is now assigned to Cerberus Fossae). PNG
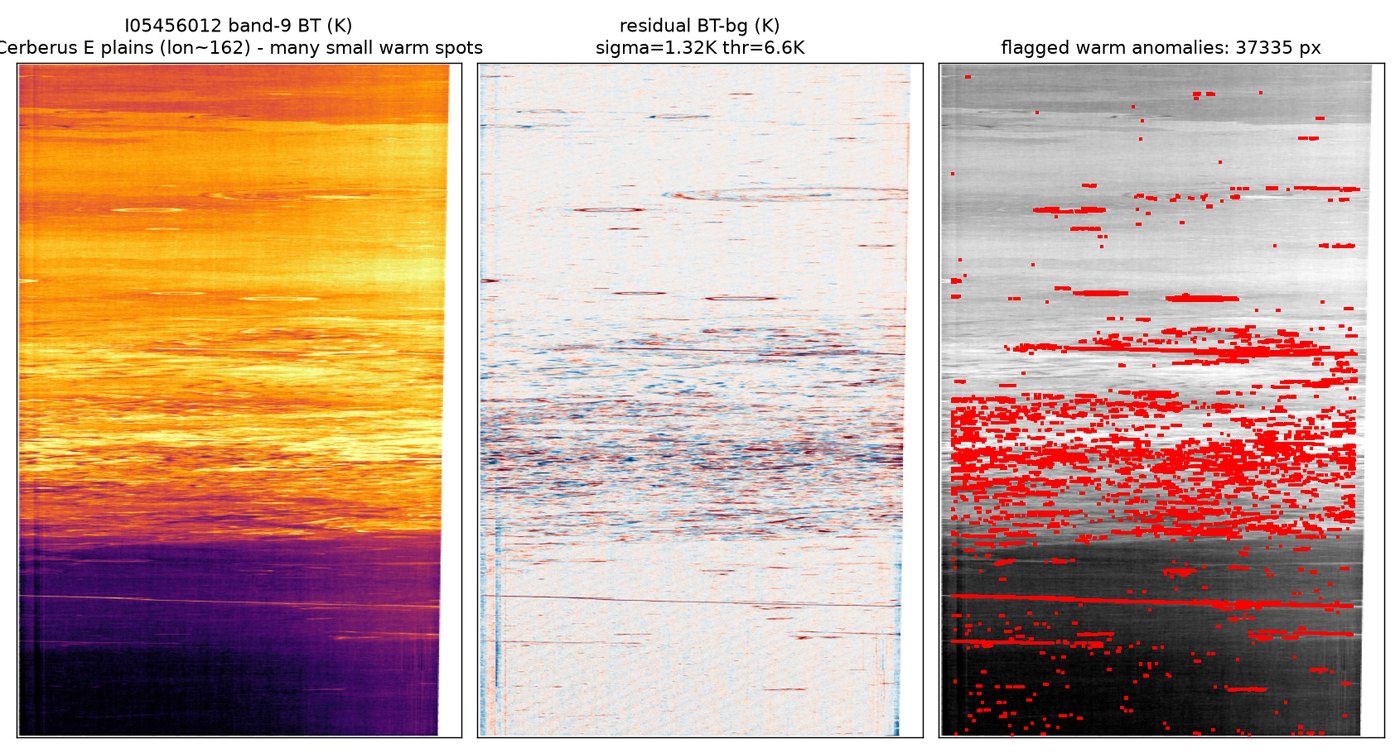
Cerberus plains nighttime image I05456012: brightness temperature, residual, and flagged clusters. Warm anomalies form terrain-following bands. PNG
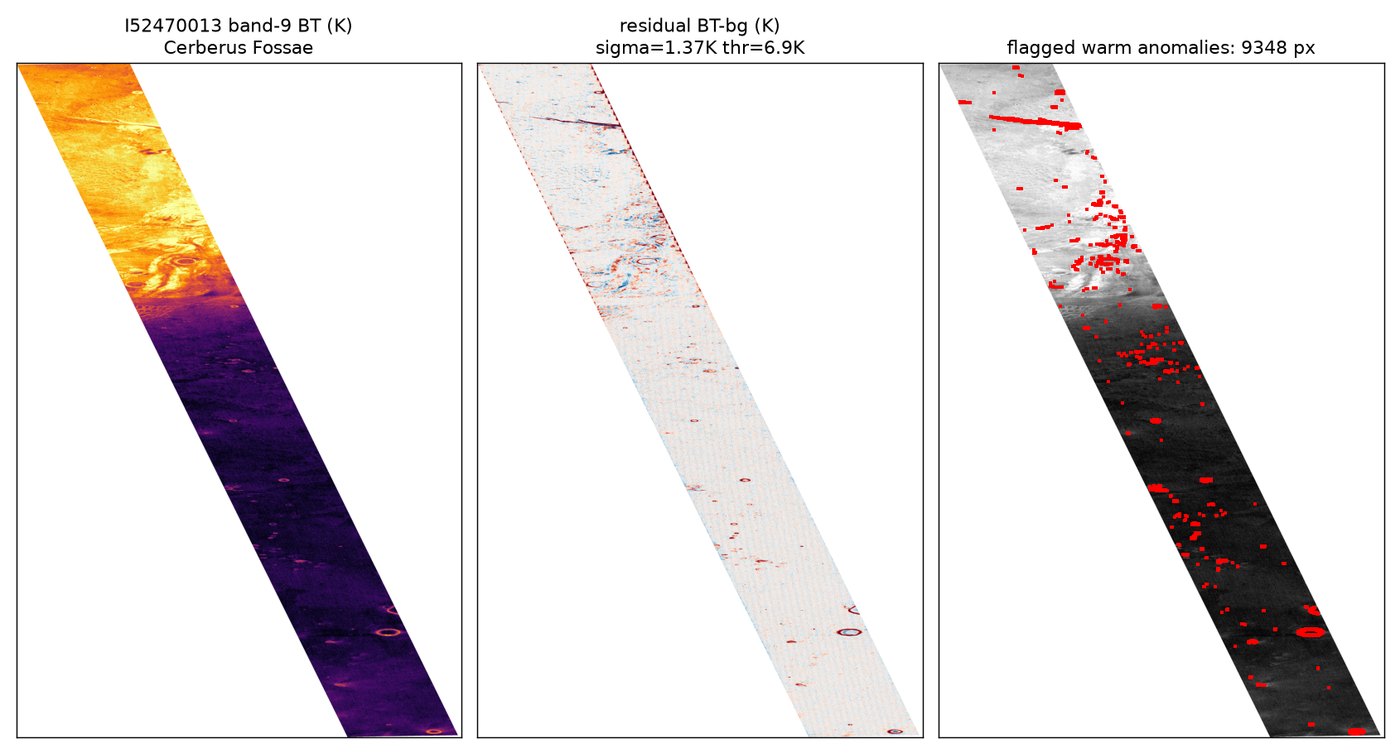
Cerberus Fossae image I52470013 (σ 1.37 K): the fossa walls and rocky patches are warm; nothing is isolated. PNG
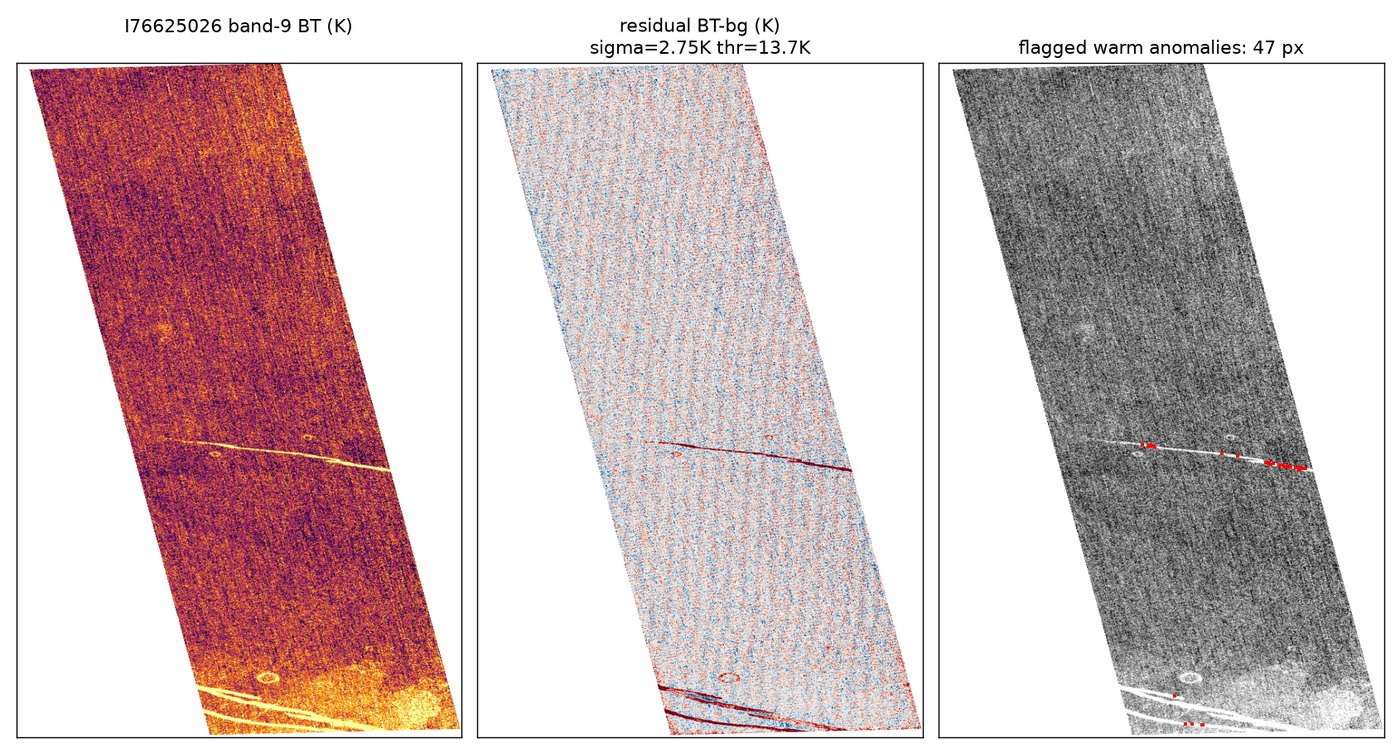
A striped image (σ 2.75 K) whose bright scan line is flagged as a linear artifact; such images fail the cleanliness cut. PNG
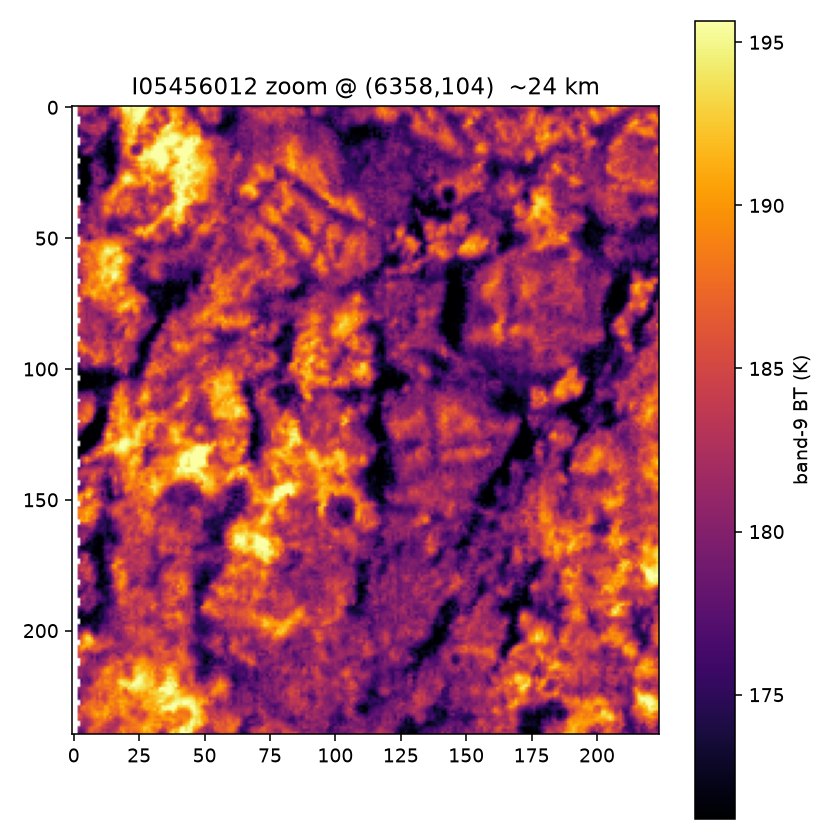
24 km close-up of a Cerberus candidate field: warm patches follow polygonal terrain boundaries. PNG
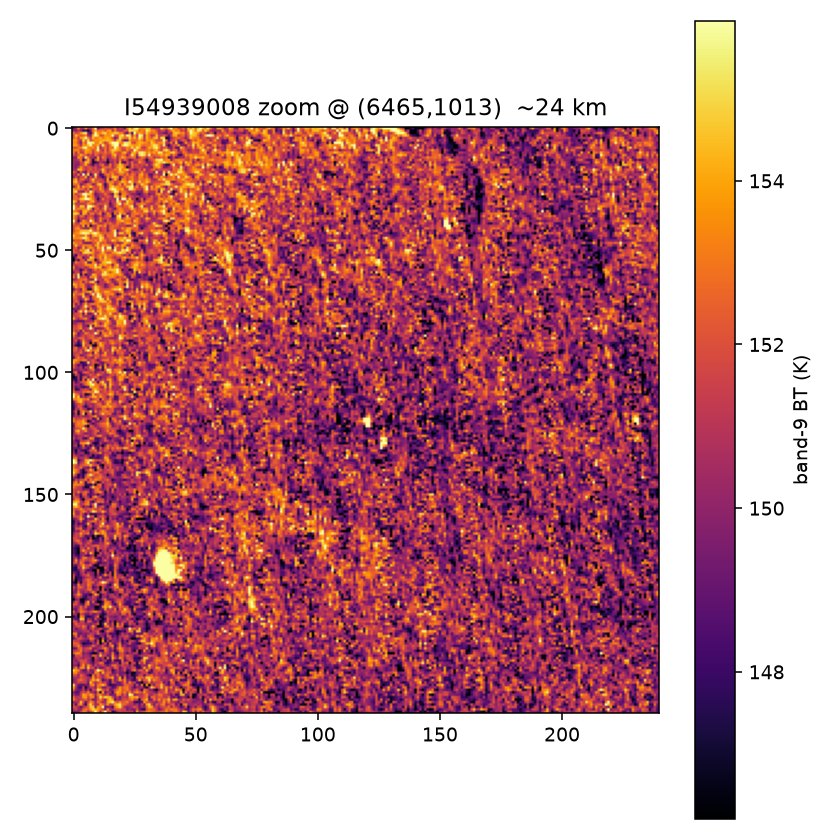
The strongest one-off focused detection (I54939008, Ascraeus Mons, +17.6 K, 10 px, 11.60°N 254.67°E): a compact bright spot at only ~170 K absolute. PNG
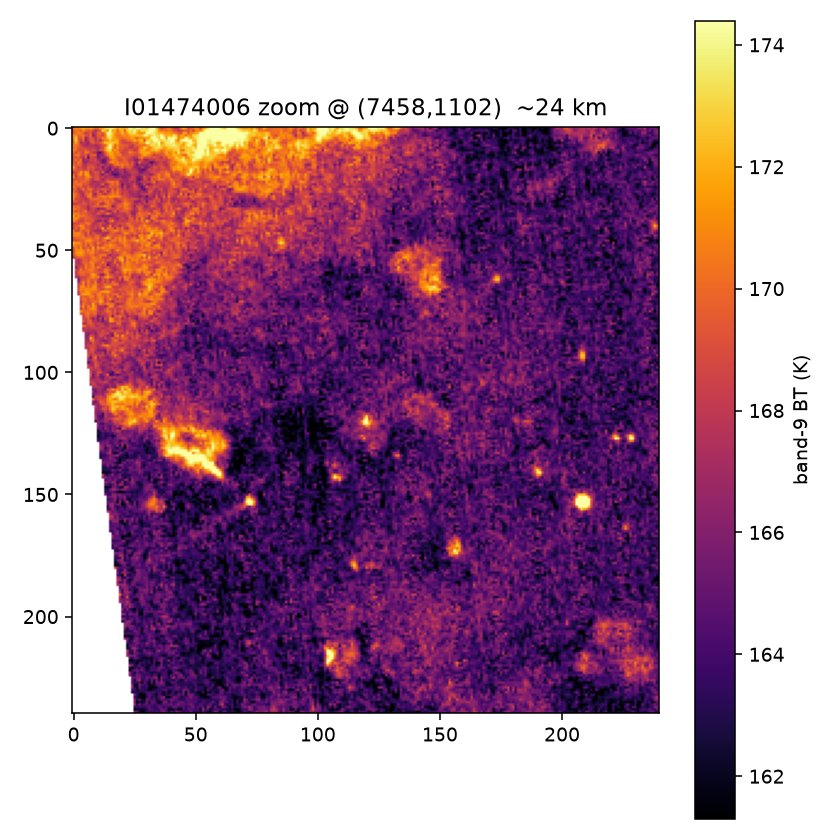
Second-strongest one-off (I01474006, Cerberus, +15.6 K, 3.69°N 159.96°E); the global census lists persistent rocky cells 2–4 km away. PNG

Invisibility physics

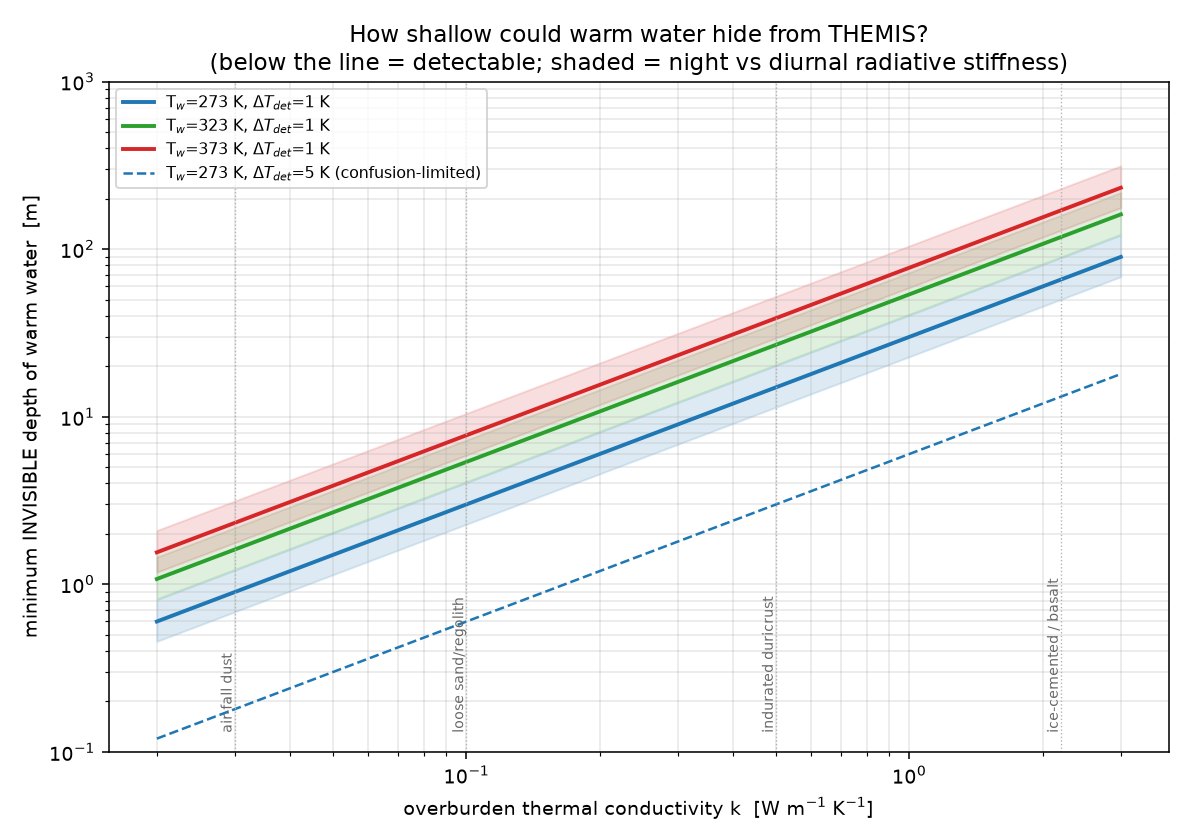
Shallowest depth at which warm water stays thermally invisible (< 1 K surface warming) vs overburden conductivity: ~1 m under dust, ~66 m under ice-cemented rock for 273 K water. PNG

Global search and Bayesian bound

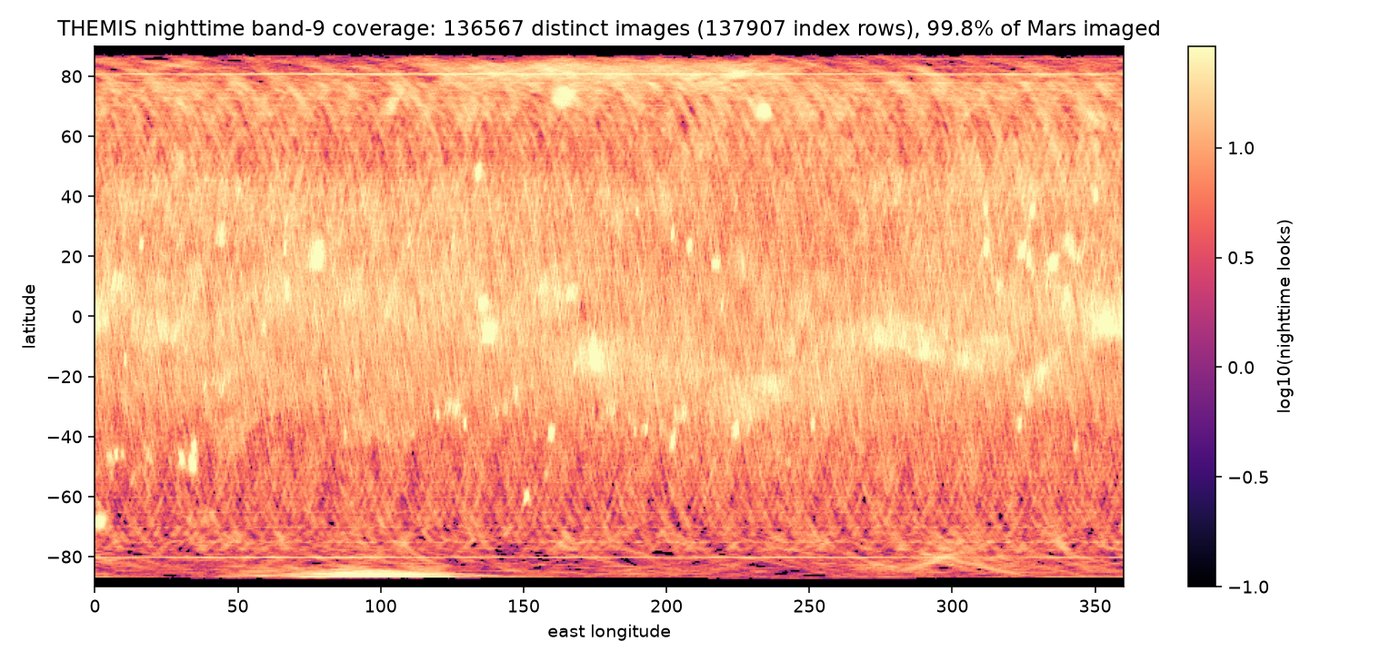
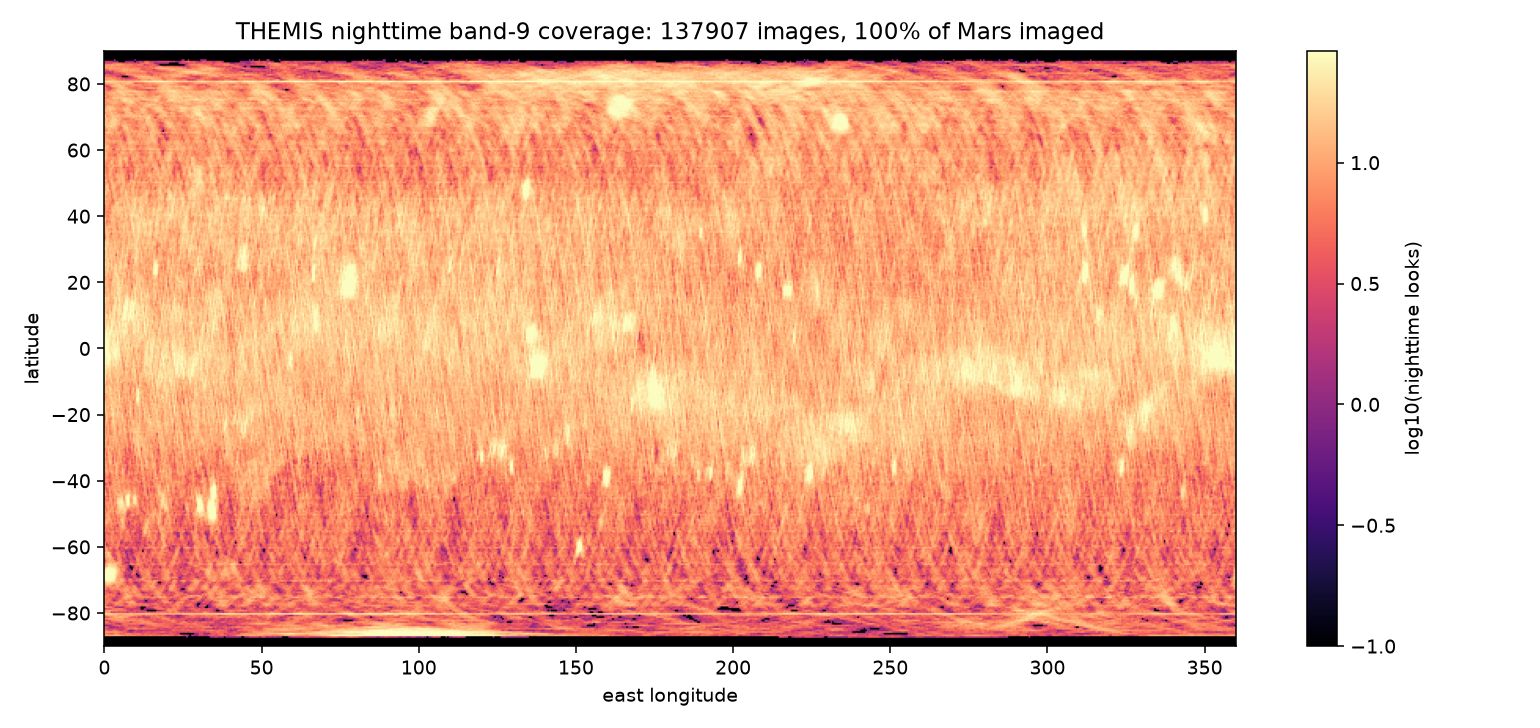
Nighttime band-9 coverage: 99.8% of Mars imaged at least once, median 10 looks per location (v2: title corrected from "100%"). PNG
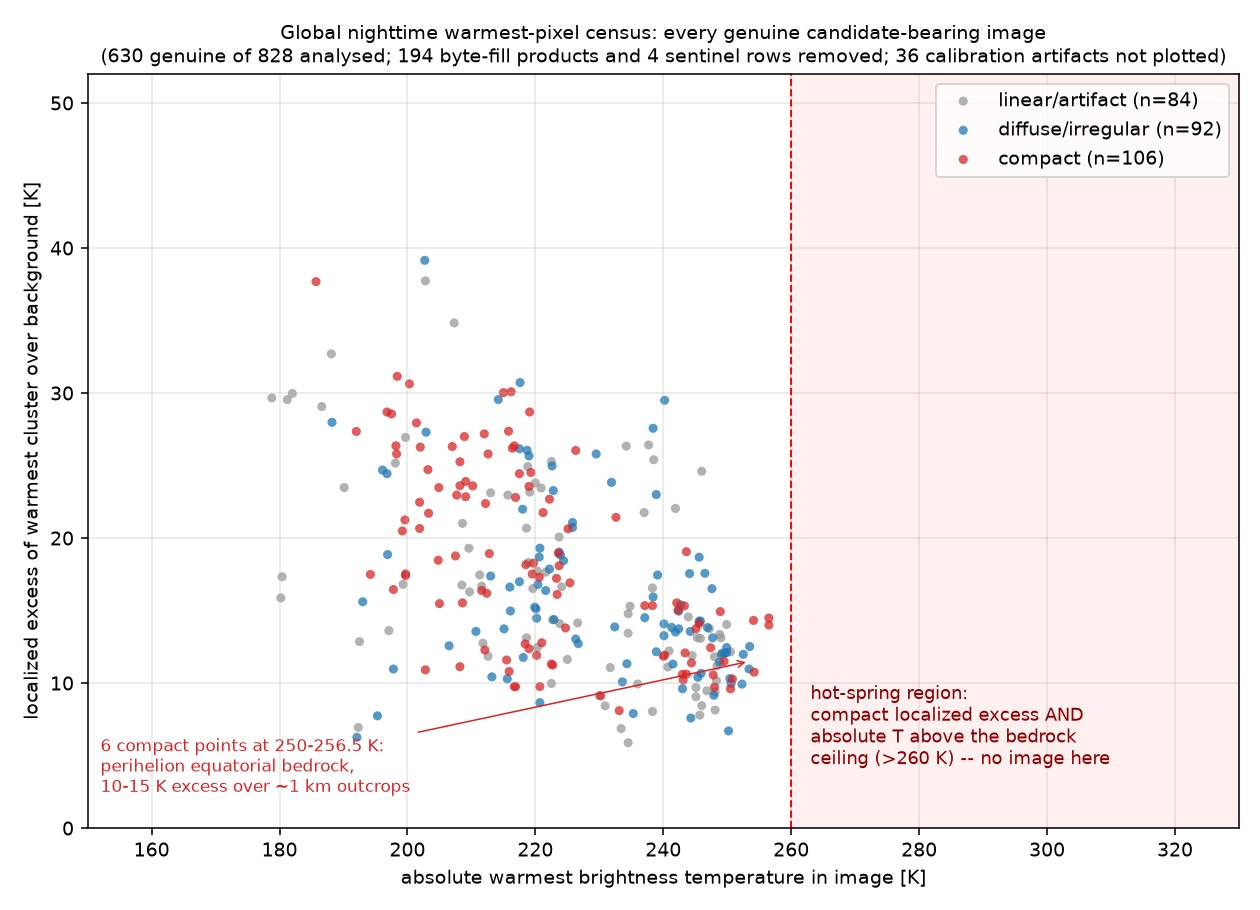
Every genuine candidate-bearing image (630 of 828 analysed; 194 byte-fill products and 4 sentinel rows removed): absolute warmest temperature vs localized excess. Nothing compact lies above the ~260 K bedrock ceiling; the six compact points at 250–256.5 K are perihelion equatorial bedrock. PNG
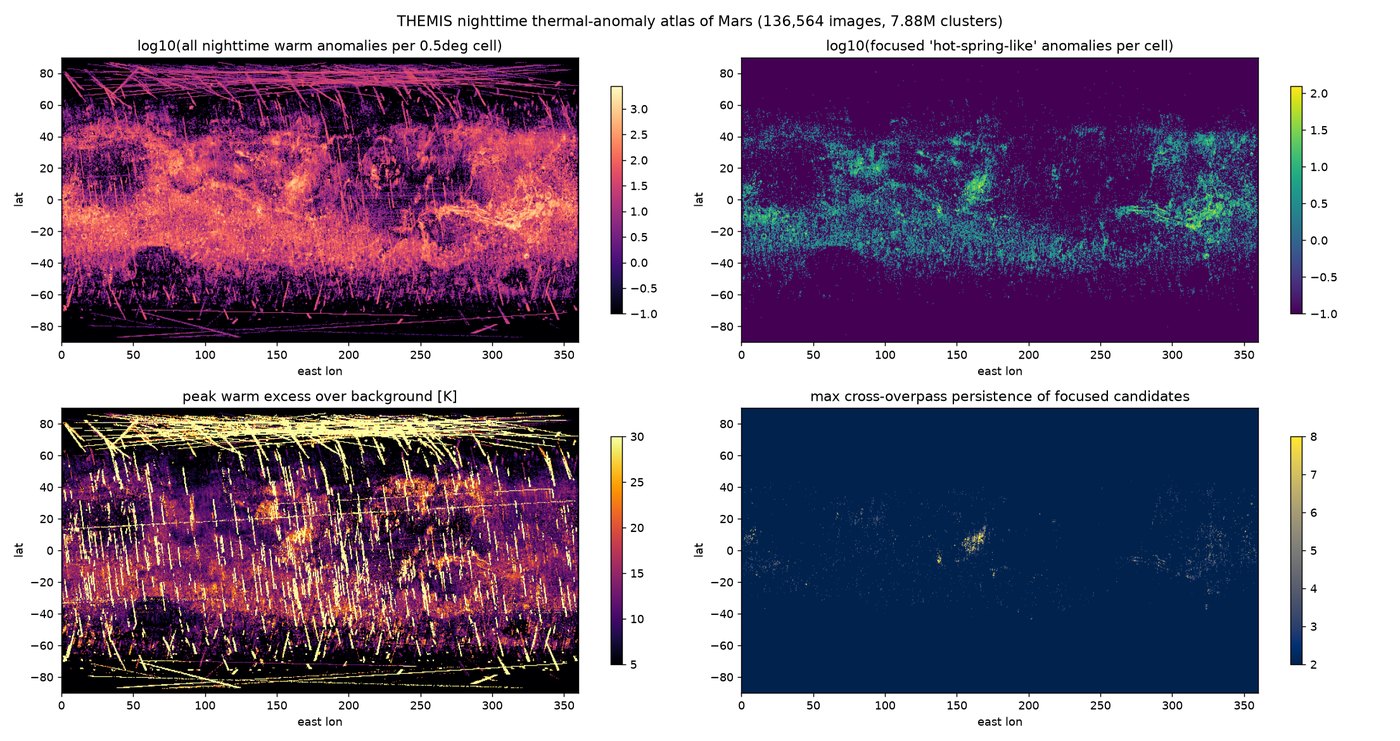
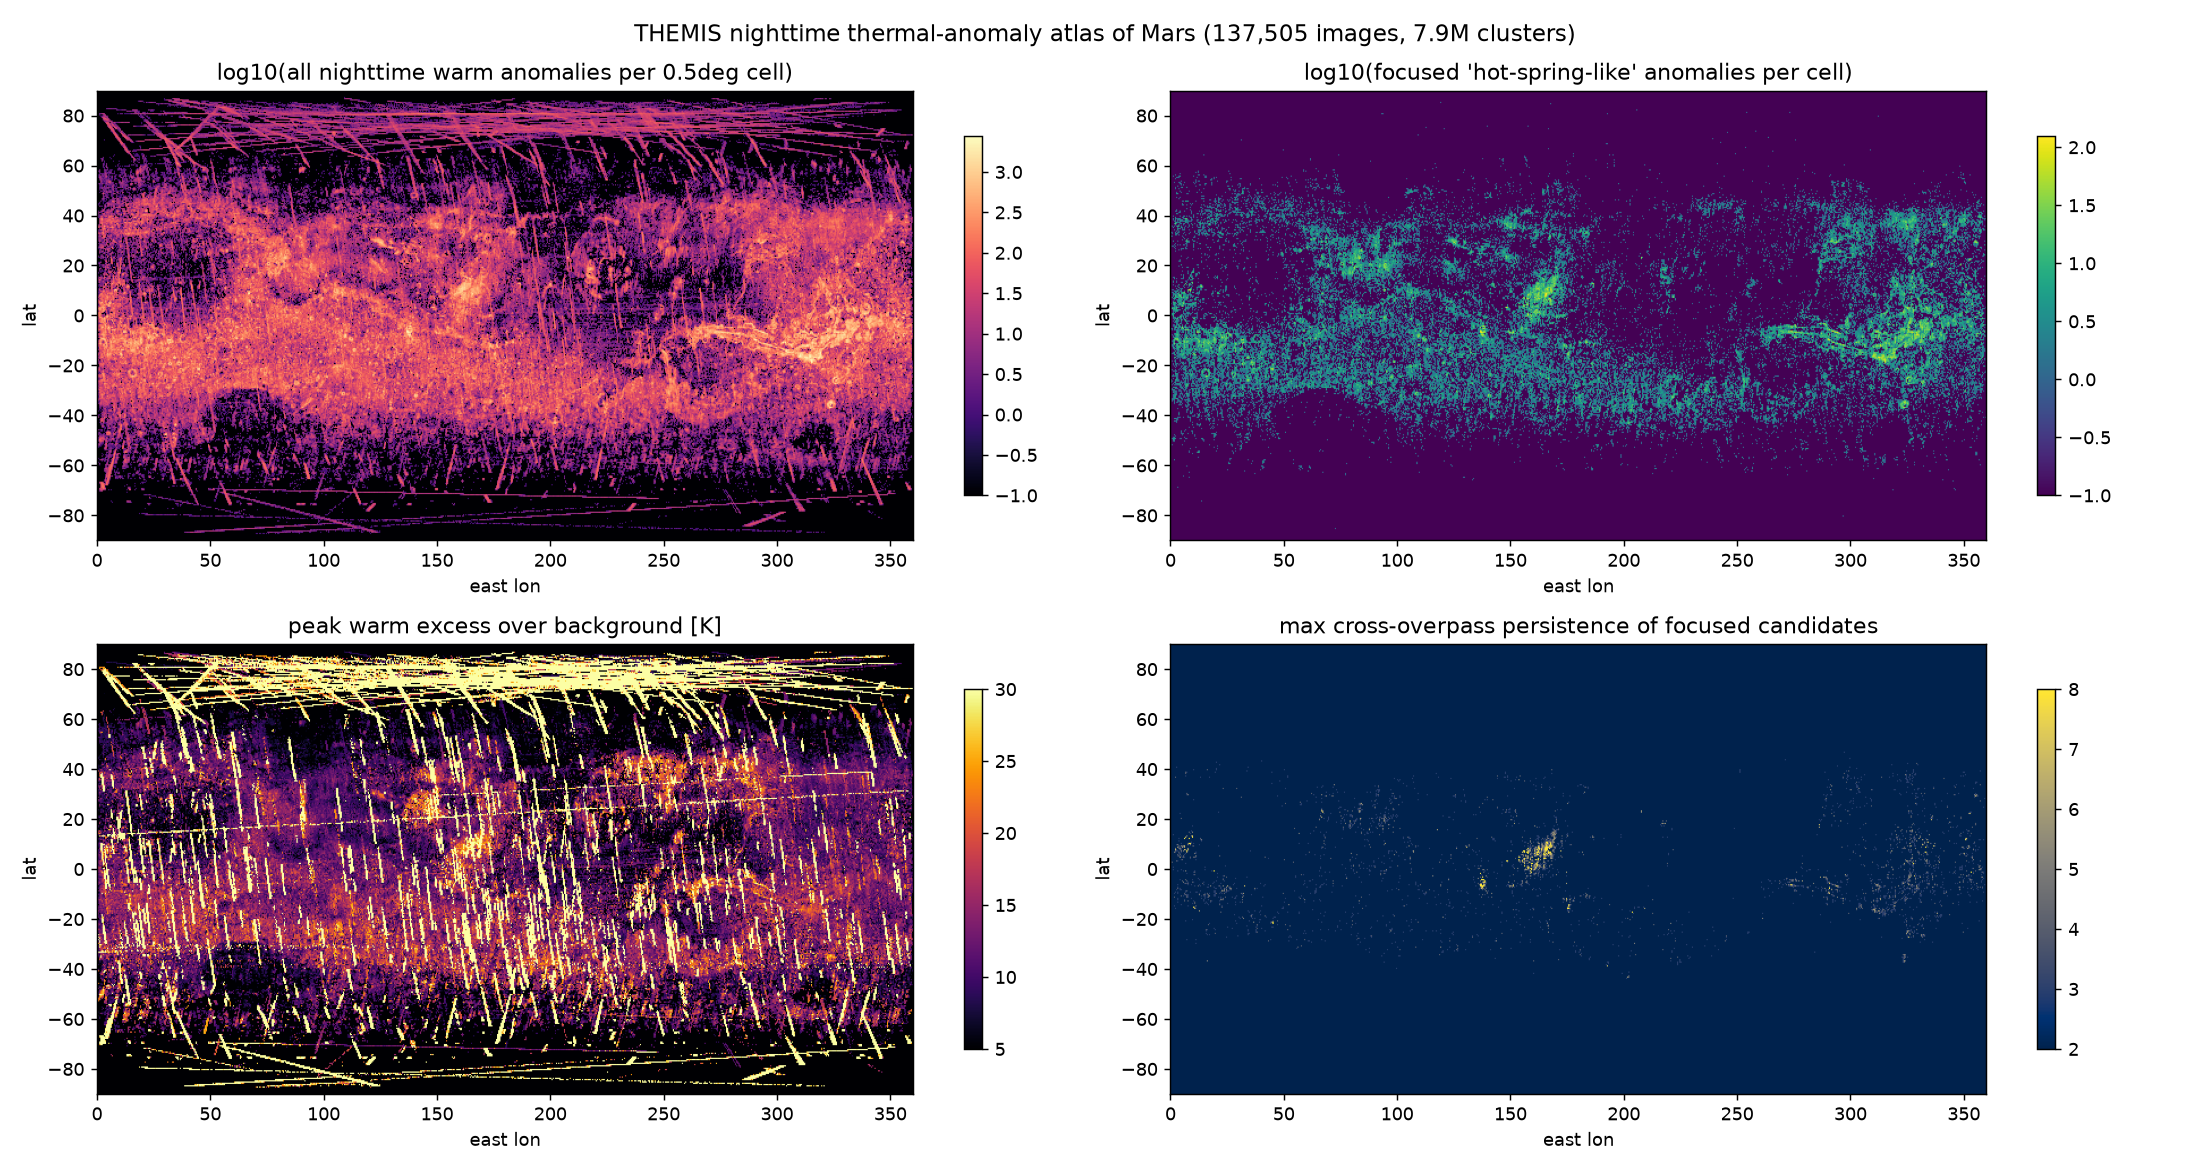
Global nighttime warm-anomaly atlas from 136,564 images and 7.88 million clusters: all-anomaly density, focused-anomaly density, peak excess, cross-overpass persistence (v2: title count corrected). PNG
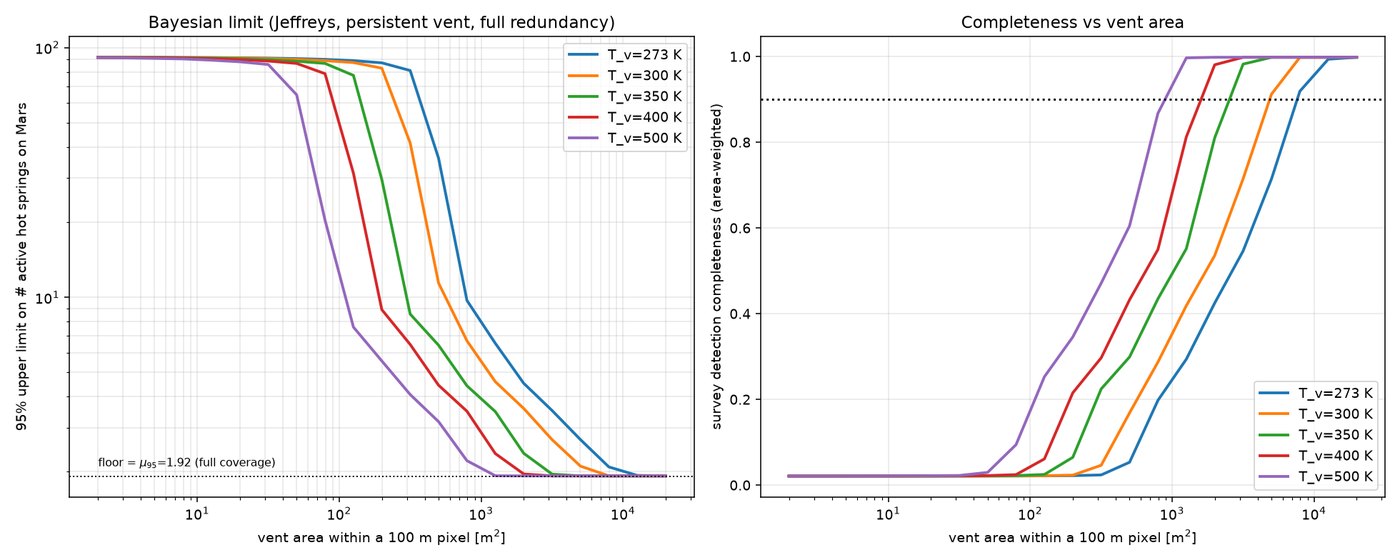
Bayesian 95% upper limit on the number of active vents vs vent area (left) and survey completeness (right). Floor μ₉₅ = 1.92 at full coverage. PNG

Depth to liquid water

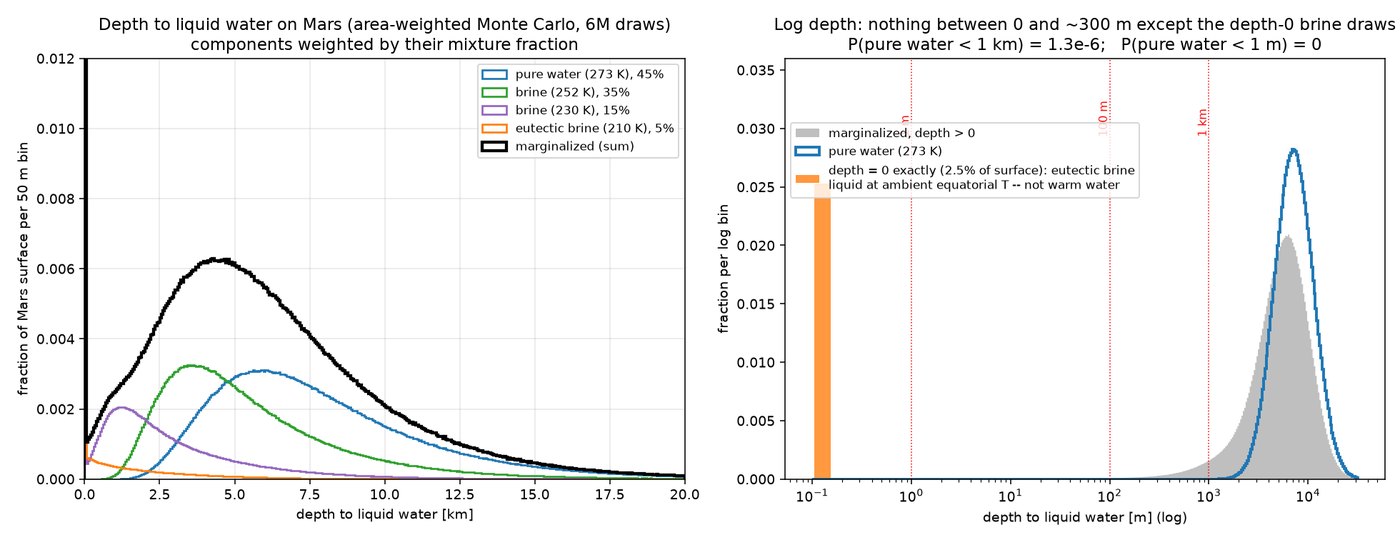
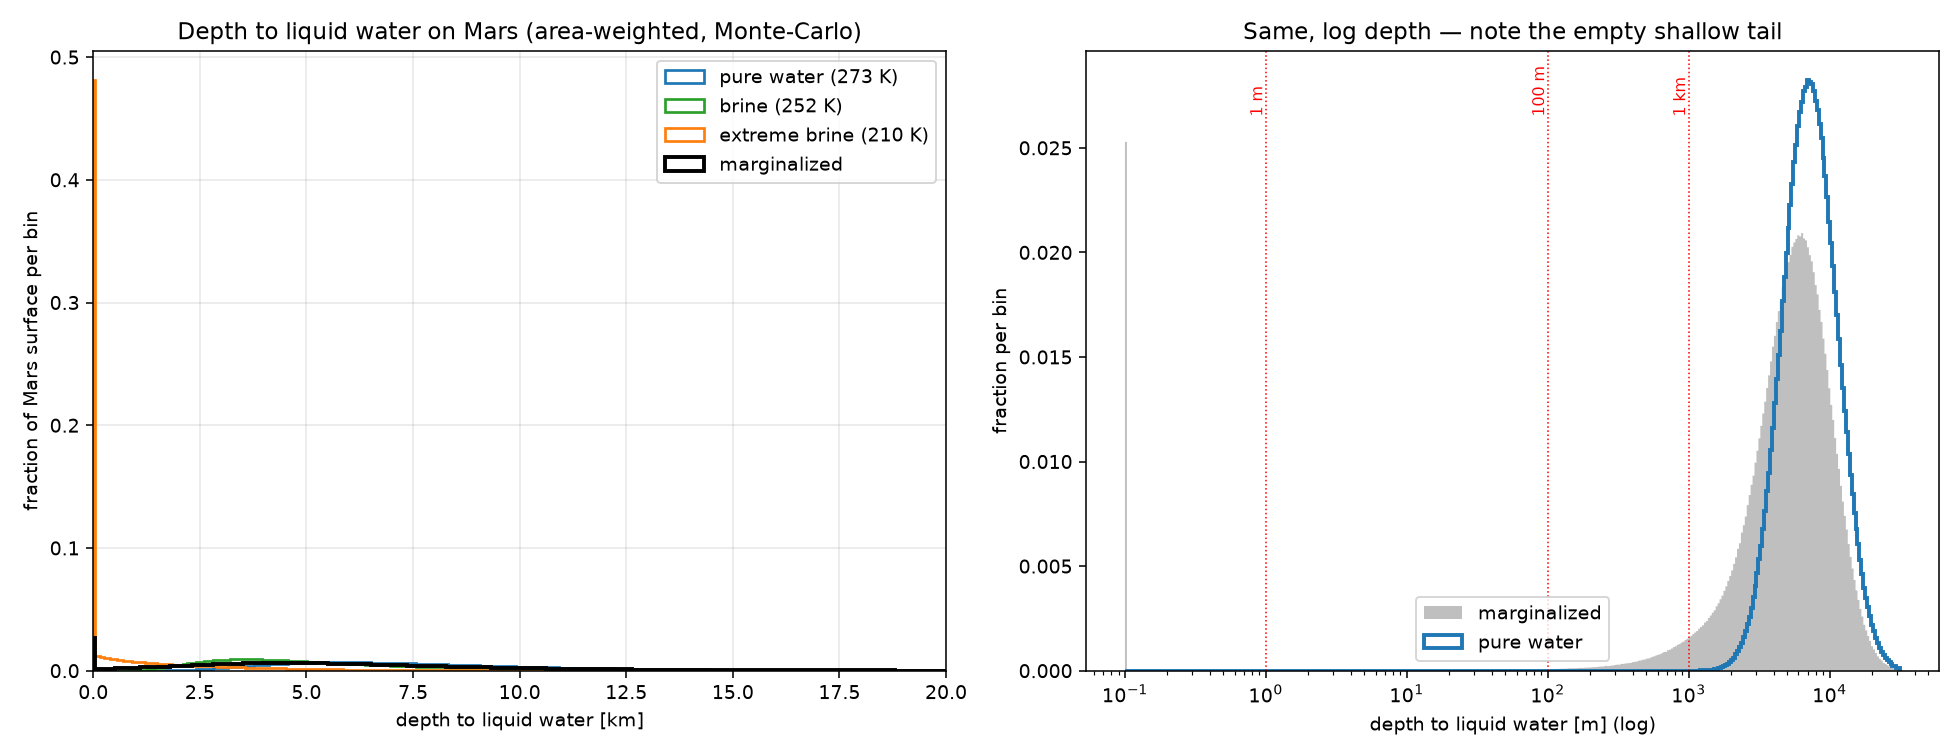
Depth to liquid water, area-weighted Monte Carlo; components weighted by mixture fraction (v2). Pure water median 7.2 km, marginalized 5.4 km; the depth-0 bar is ambient-temperature eutectic brine. PNG
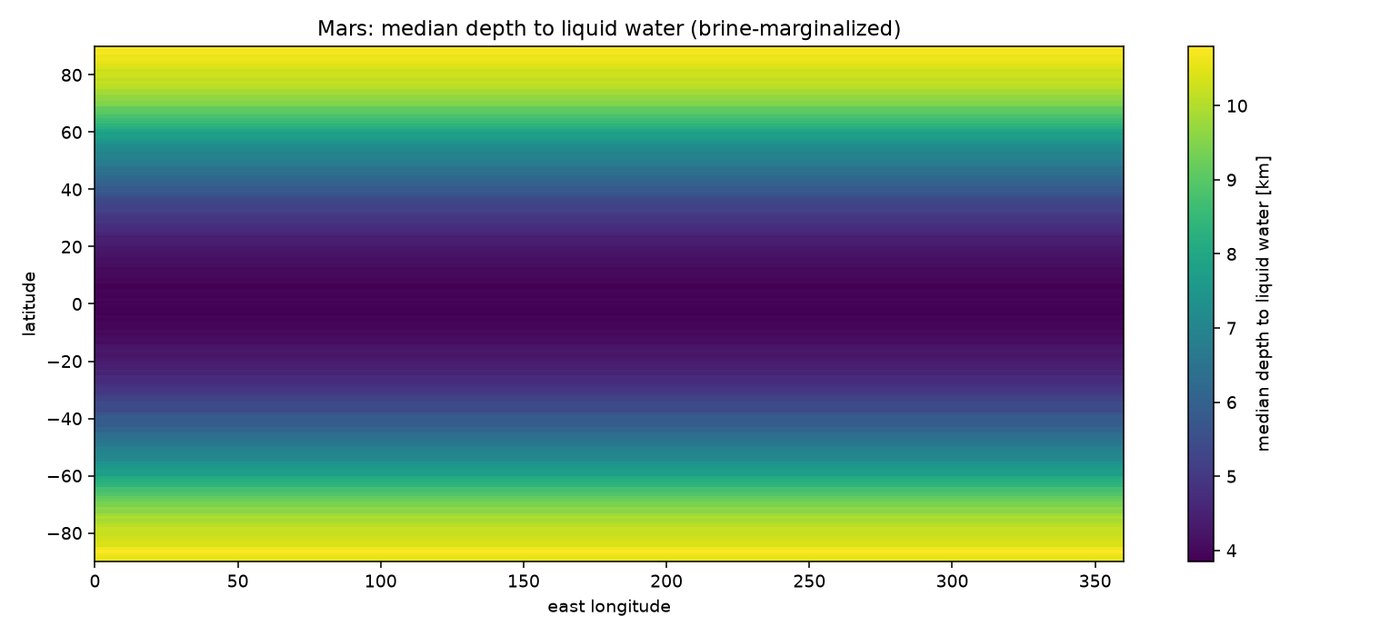
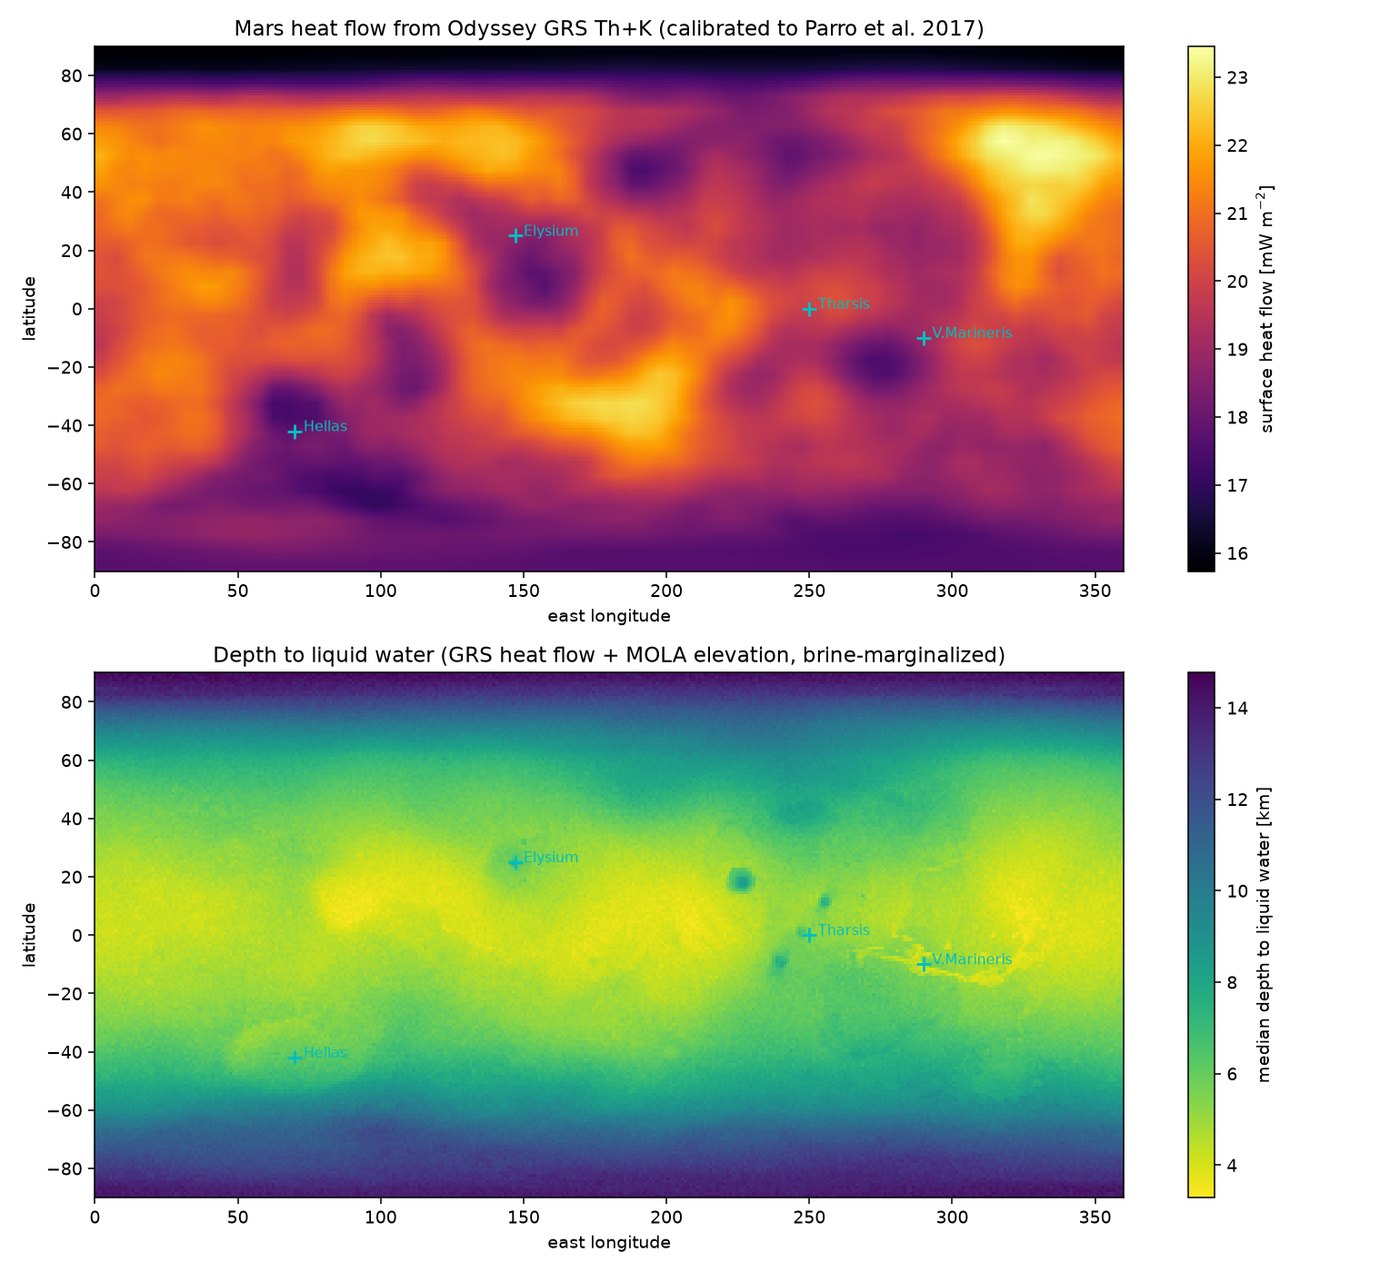
Latitude-driven median depth to liquid water: ~4 km at the equator, ~11 km at the poles. PNG
GRS-derived surface heat flow (top) and the 2-D depth-to-liquid-water atlas with MOLA elevation (bottom). PNG

Day–night tests

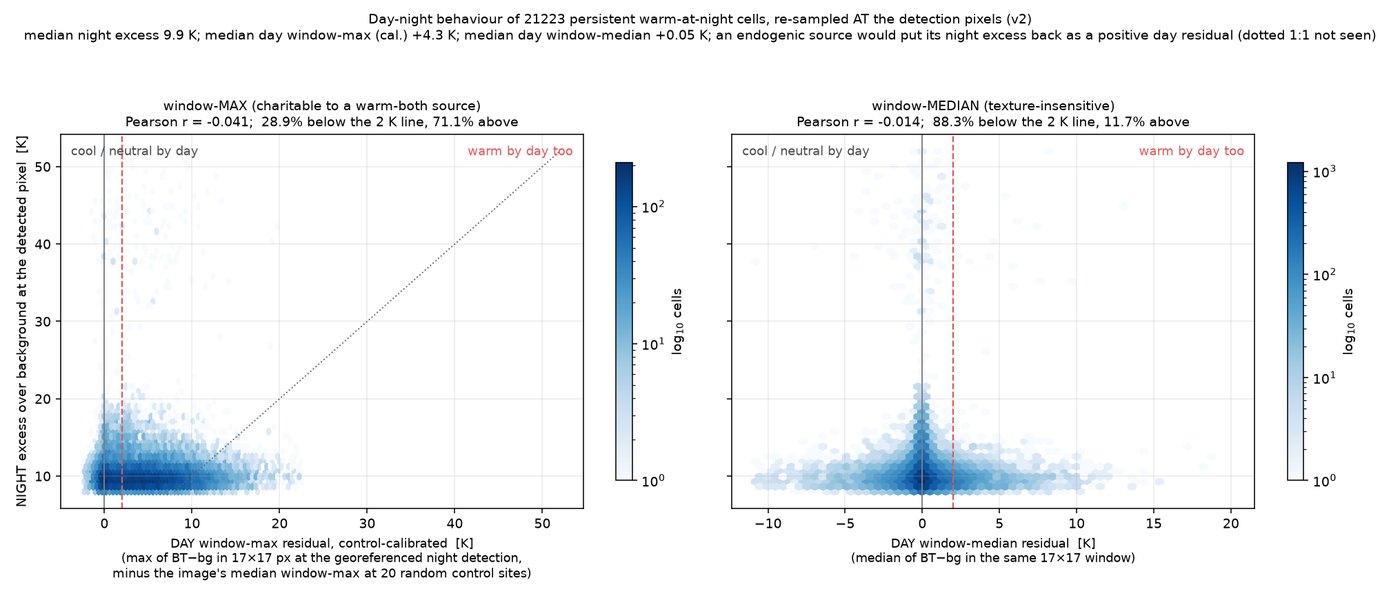
Day–night behaviour of 21,223 persistent cells re-sampled at the detected pixels (v2): night excess vs calibrated day window-maximum (left) and day window-median (right). r = −0.04 / −0.01; nothing follows the 1:1 line an internal source would trace. PNG
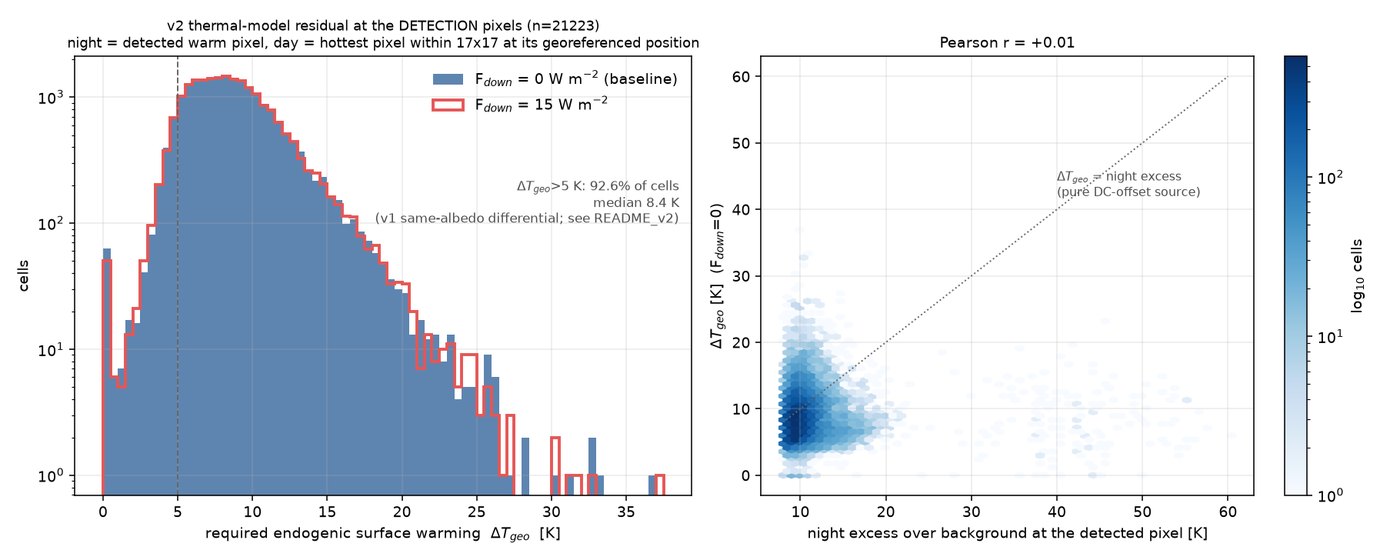
Thermal-model residual at the detected pixels (v2). Left: the same-albedo differential statistic with and without a 15 W/m² sky flux; right: it does not track the night excess (r = 0.01). The albedo-free ceiling is zero for 94–98% of cells. PNG
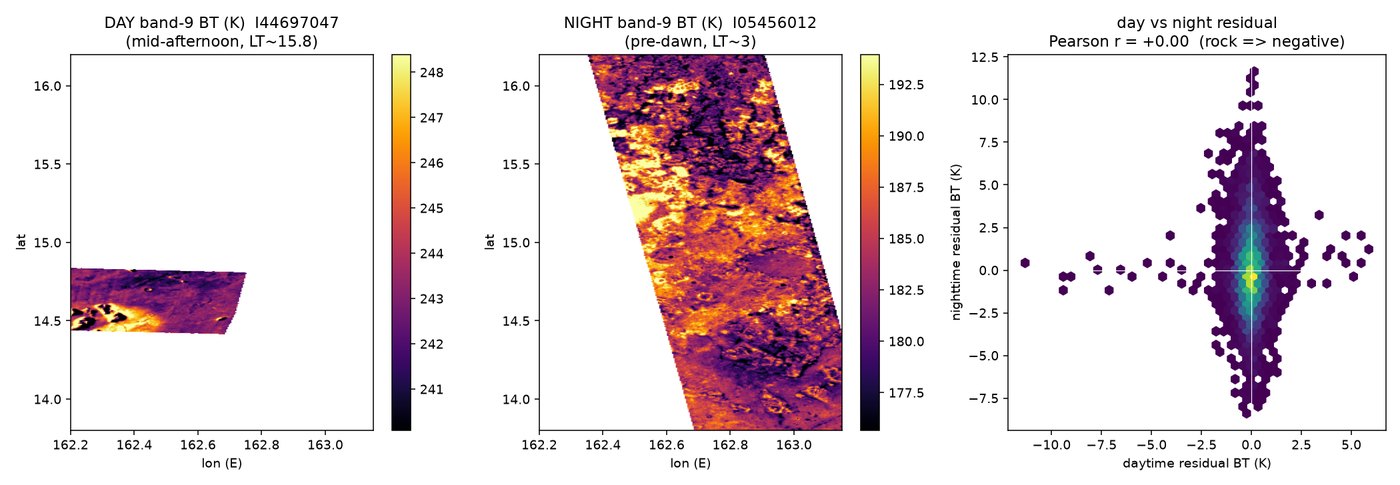
Example day/night image pair over a Cerberus candidate field; the two overlap only in a ~0.3° corner. PNG

Global mosaic

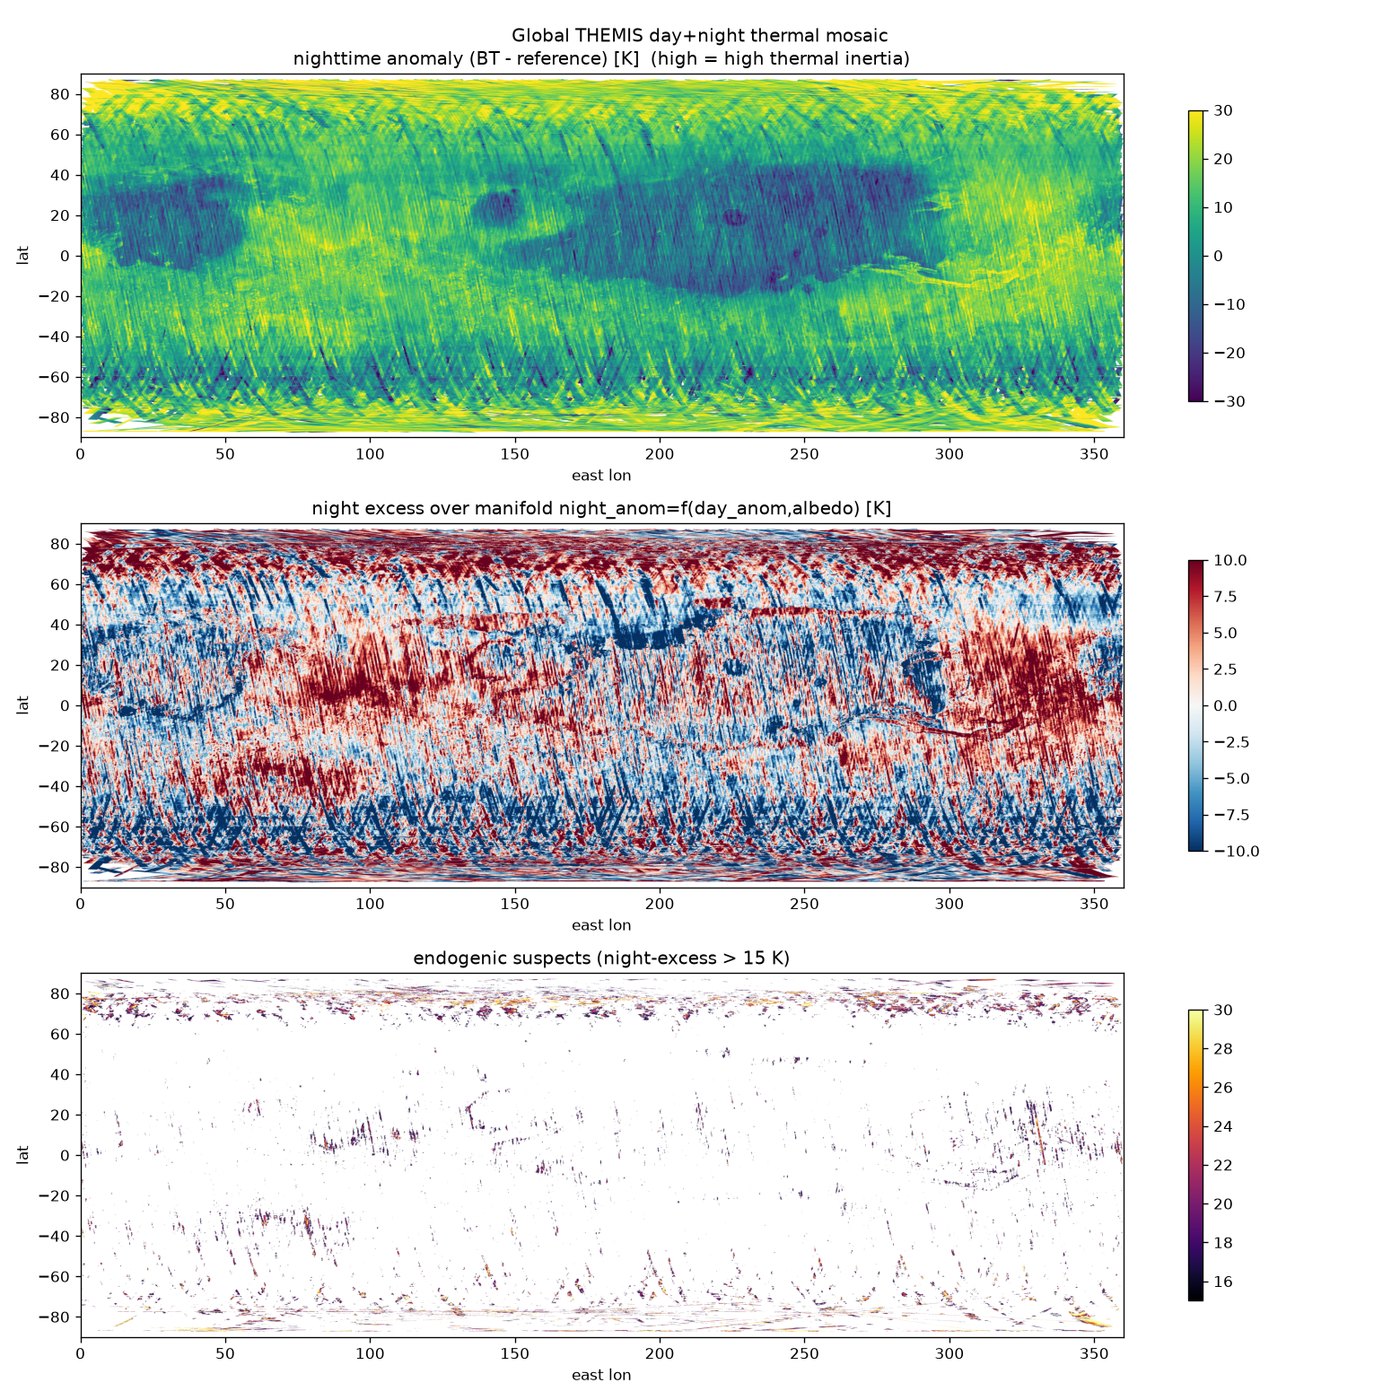
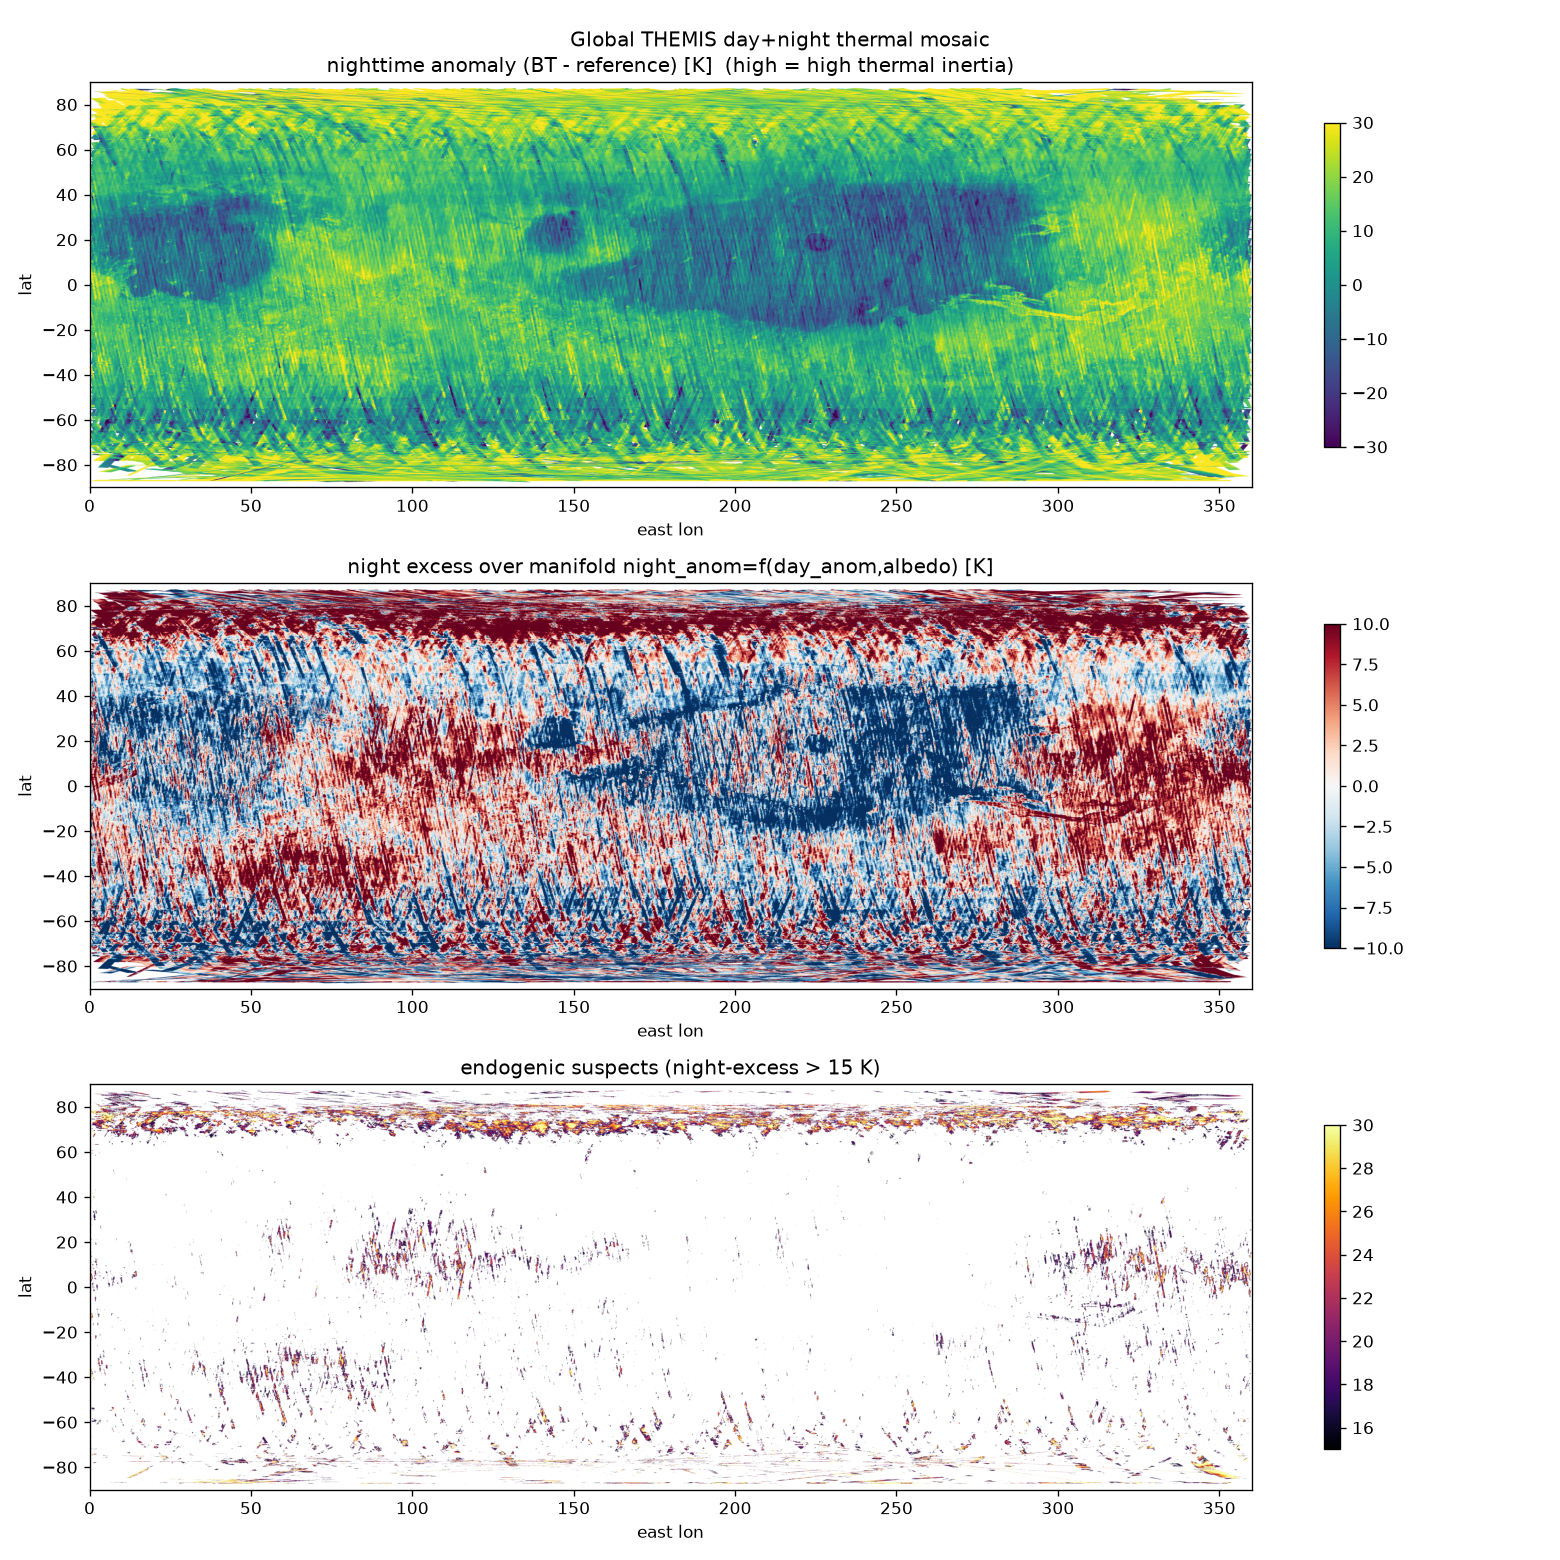
Destriped global day+night mosaic from 335,425 images (v2: albedo registration corrected): nighttime thermal-inertia anomaly, night excess over the day-and-albedo manifold, and cells above the 15 K screen. PNG

Superseded originals (kept for the record)

These are the 2026-07 versions replaced on 2026-09-07. See the error check for what was wrong with each.

global_quadrant.png

Boundary at 250 K labelled "EMPTY" with six bedrock points inside; included byte-fill products. PNG
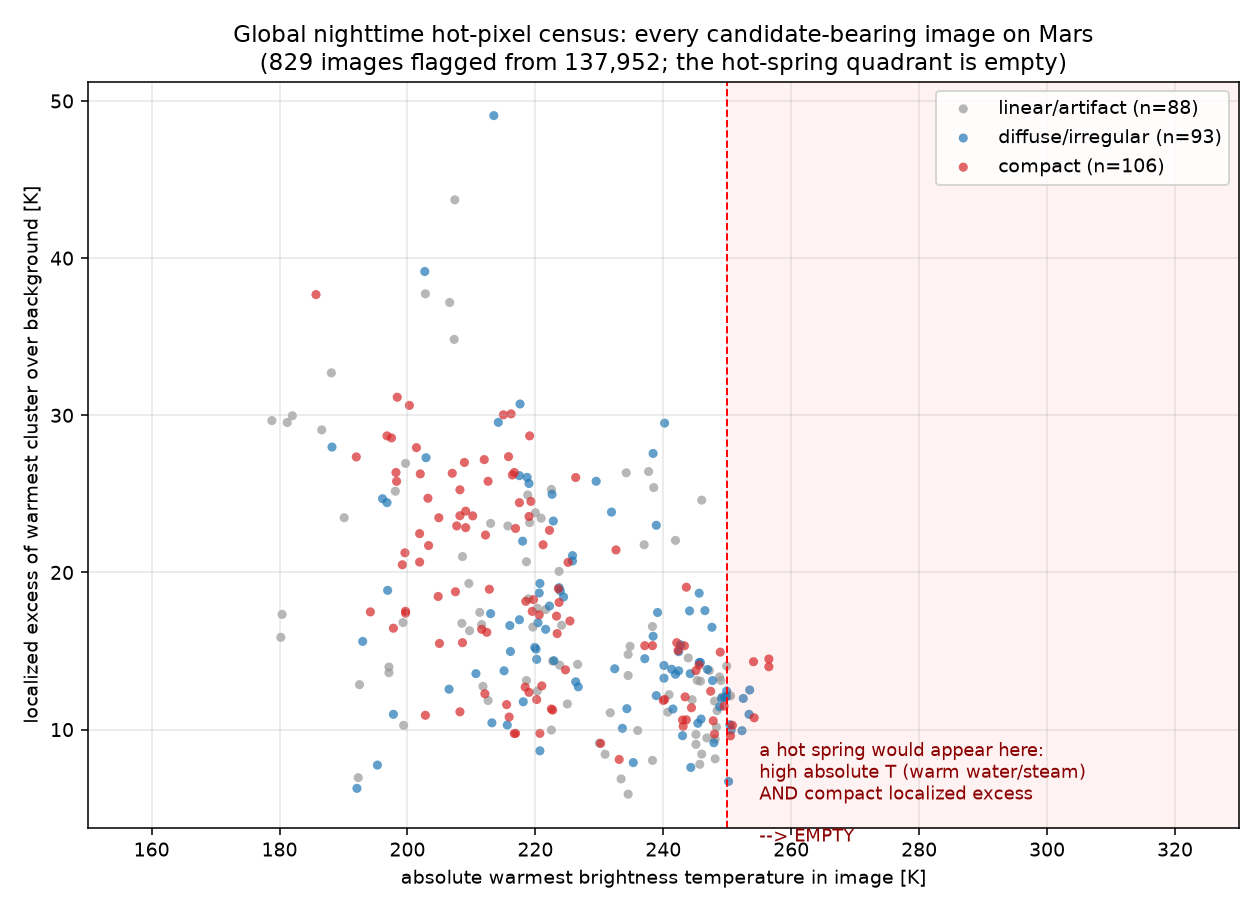
daynight_discrimination.png

Sampled at cell-mean positions, a median of 3 px from the detections. PNG
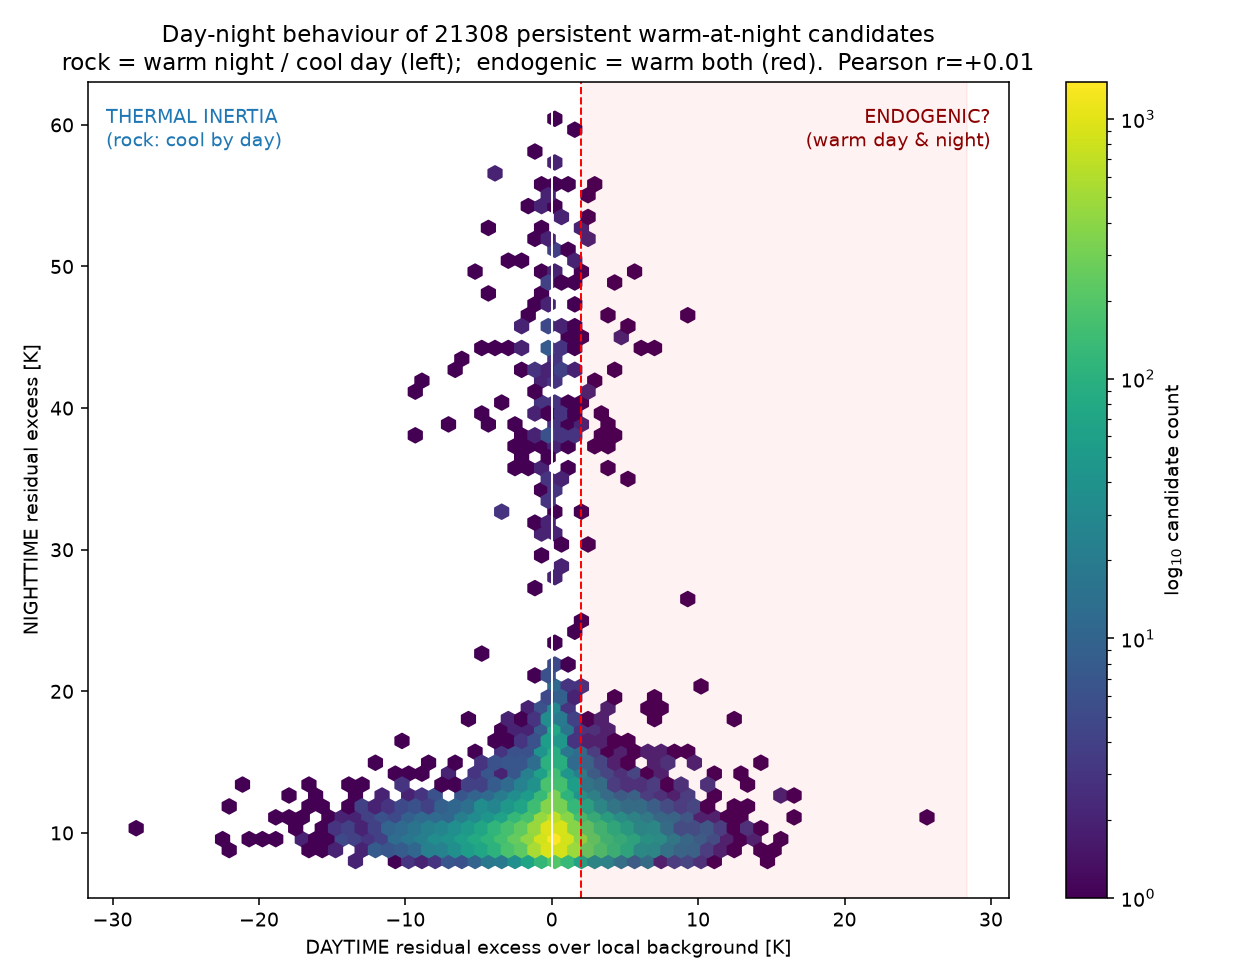
endogenic_residual.png

Same sampling problem; its 0.01 K median was background-vs-background. PNG
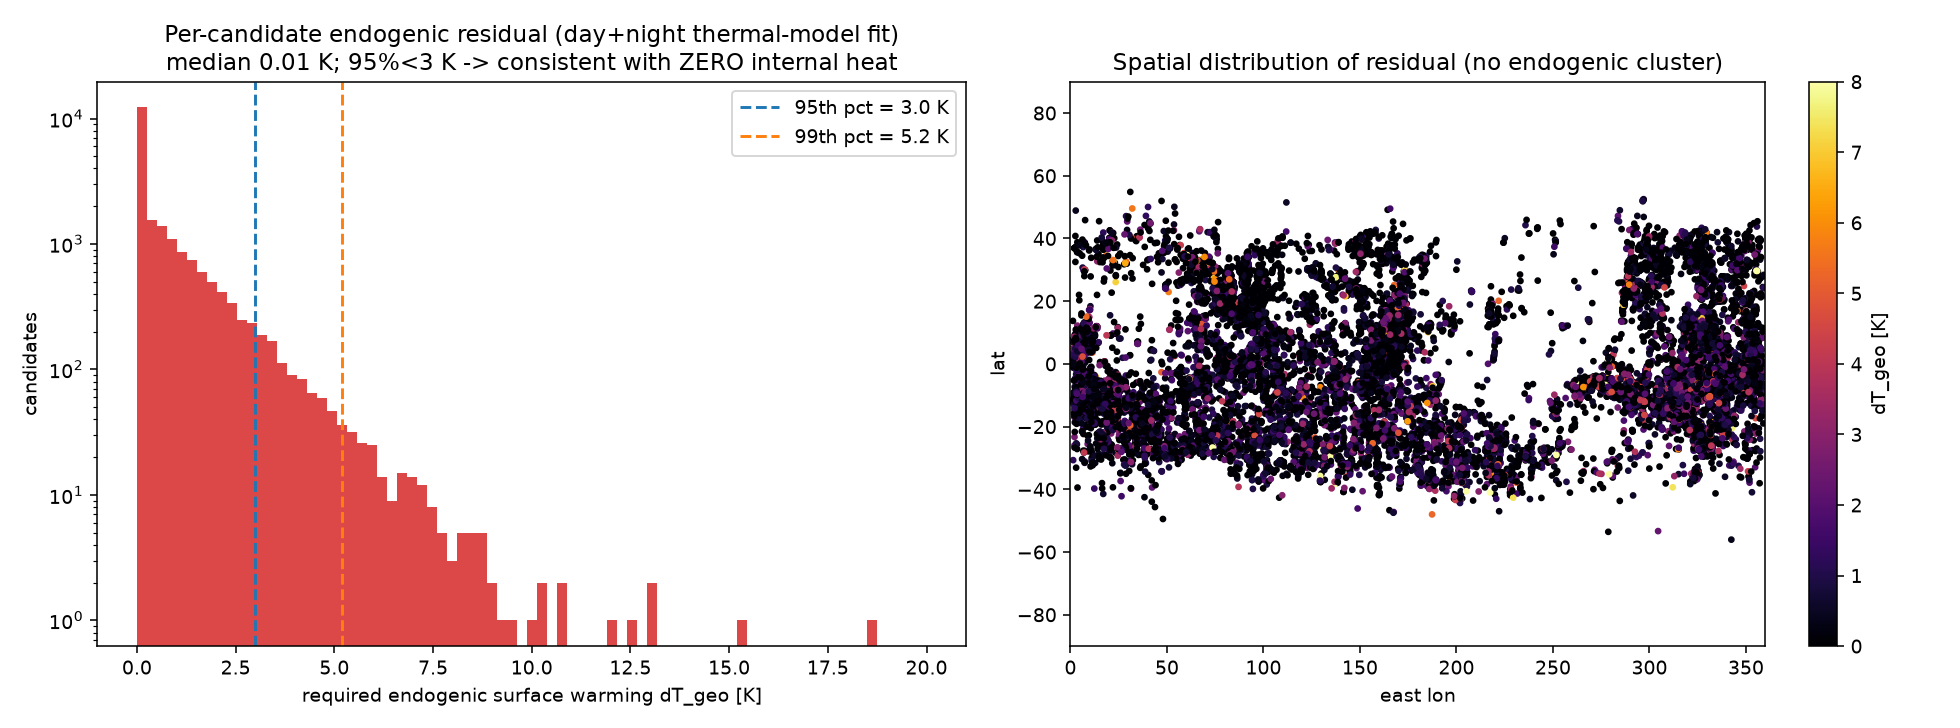
global_daynight_mosaic.png

TES albedo misregistered by 180° of longitude. PNG
depth_to_water_hist.png

Components each normalized to one; depth-0 draws drawn as a spike at 10 cm. PNG
coverage_map.png, global_anomaly_atlas.png, fig_by_region.png

Title counts "100%", "137,505 images", and a "?" region bar. PNG · PNG · PNG